

A cartridge can look correct, shave normally in a brief functional check, and still contain a weak weld or incomplete stake. Visual inspection may miss a small weld nugget, an under-formed post, local blade distortion, or a joint damaged during downstream assembly. If that defect reaches shipment, the technical buyer faces razor blade retention risk, complaint investigation, lot containment, and possible recall exposure without data that identifies the responsible station. The problem becomes worse when a Supplier reports only average pull force, because one high-strength joint can hide one critically weak location. The solution is a drawing-linked destructive plan that separates weld and staking mechanisms, records force-displacement behavior, sections representative joints, samples every assembly station, and classifies the actual failure path before product release.
A qualified Supplier controls razor blade weld strength through validated pull or push fixtures, station-based destructive sampling, sectioned joint evidence, calibrated force measurement, traceable failure classification, and drawing-specific limits. Haward applies this evidence chain to Customizable OEM and ODM cartridge programs rather than approving assembly strength by appearance alone.
Manufacturing engineers, QA managers, and technical buyers should continue. The following sections expose the practical controls behind fixture correlation, weld sectioning, sampling frequency, failure signatures, and supplier change management—the details often hidden behind a pass/fail certificate as cartridge programs move from pilot runs into stable mass production.
Separate Weld Strength, Staking Strength, and Complete-Cartridge Retention
Map Every Load Path Before Selecting the Destructive Test
Cartridge assembly integrity is a system property, not one isolated force value. Depending on the design, a blade may be welded to a support, positioned by molded features, trapped by a cap, or retained by staked plastic or metal posts. A complete-cartridge pull can therefore fail at the housing before it loads the intended weld. That result may be relevant to end-product retention, but it does not measure the weld alone.
The Manufacturer and buyer should create a joint map that identifies:
- each blade, support, spacer, clip, cap, guard, and staking post;
- the number and location of welds or formed retention points;
- the functional loading direction for every retained component;
- the expected first failure and the prohibited failure modes; and
- the drawing characteristic controlled by each destructive method.
Use a coupon or partially assembled subcomponent when the purpose is razor blade weld strength. Use a finished cartridge when the purpose is overall razor blade retention. A blade staking test requires its own fixture and failure codes. Combining these results under one “assembly strength” label removes the diagnostic value needed for OEM approval.
Design Pull and Push Fixtures Around the Intended Failure Mode
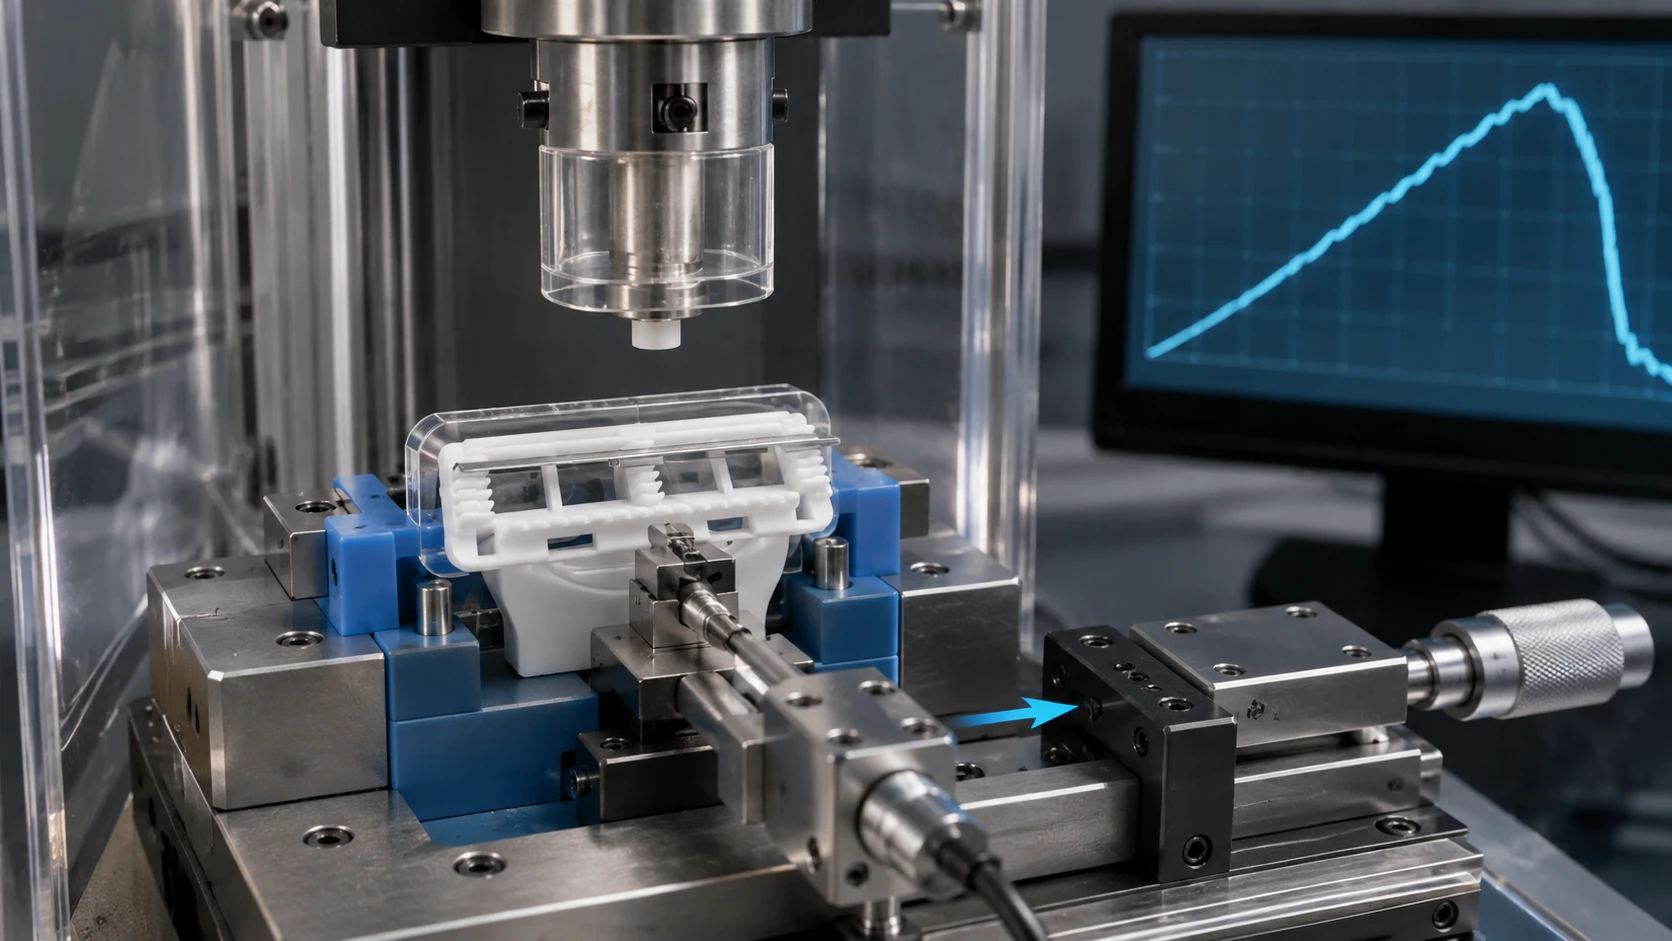
Control Datum, Load Direction, Grip Damage, and Test Speed
A useful fixture loads the target joint without creating an artificial lever or cutting the blade at the grip. The cartridge nest should locate on stable drawing datums, not flexible guard fins or lubrication elements. The blade grip needs sufficient contact area to prevent slippage while keeping the sharpened edge shielded. For a push test, the probe face, contact point, and clearance beneath the component must be fixed.
- Load alignment: start within ±1° of the specified axis as a development target.
- Crosshead speed: evaluate 10–50 mm/min, then freeze one validated rate.
- Force resolution: use ≤0.1 N or at least ten times finer than the tolerance width.
- Data rate: use ≥100 Hz when a short break event could be missed.
- Reported outputs: peak force, force at displacement, energy to failure, failure location, and curve image.
These are method-development starting points, not universal acceptance requirements. ISO 7500-1:2018 provides relevant principles for calibration and verification of static force systems, but it does not prescribe a Razor fixture or limit. The Supplier must complete method correlation and fixture revision control before using the result for product release.
| Destructive Method | Primary Output | Fixture Control | Typical Diagnostic Value |
|---|---|---|---|
| Weld coupon pull | Peak force and failure mode | Coaxial grips; no blade-edge contact | Separates weld behavior from cartridge housing strength |
| Finished-cartridge pull | Functional retention force | Drawing datums and protected guard | Confirms the weakest path in the assembled product |
| Blade staking test | Post pull-out or push-through force | Probe centered on the retained feature | Detects incomplete forming, cracks, or poor post engagement |
| Peel or torsion screen | Off-axis resistance and failure path | Fixed lever arm and rotation axis | Reveals sensitivity hidden by straight tensile loading |
Use Sectioning to Verify What the Force Curve Cannot Show
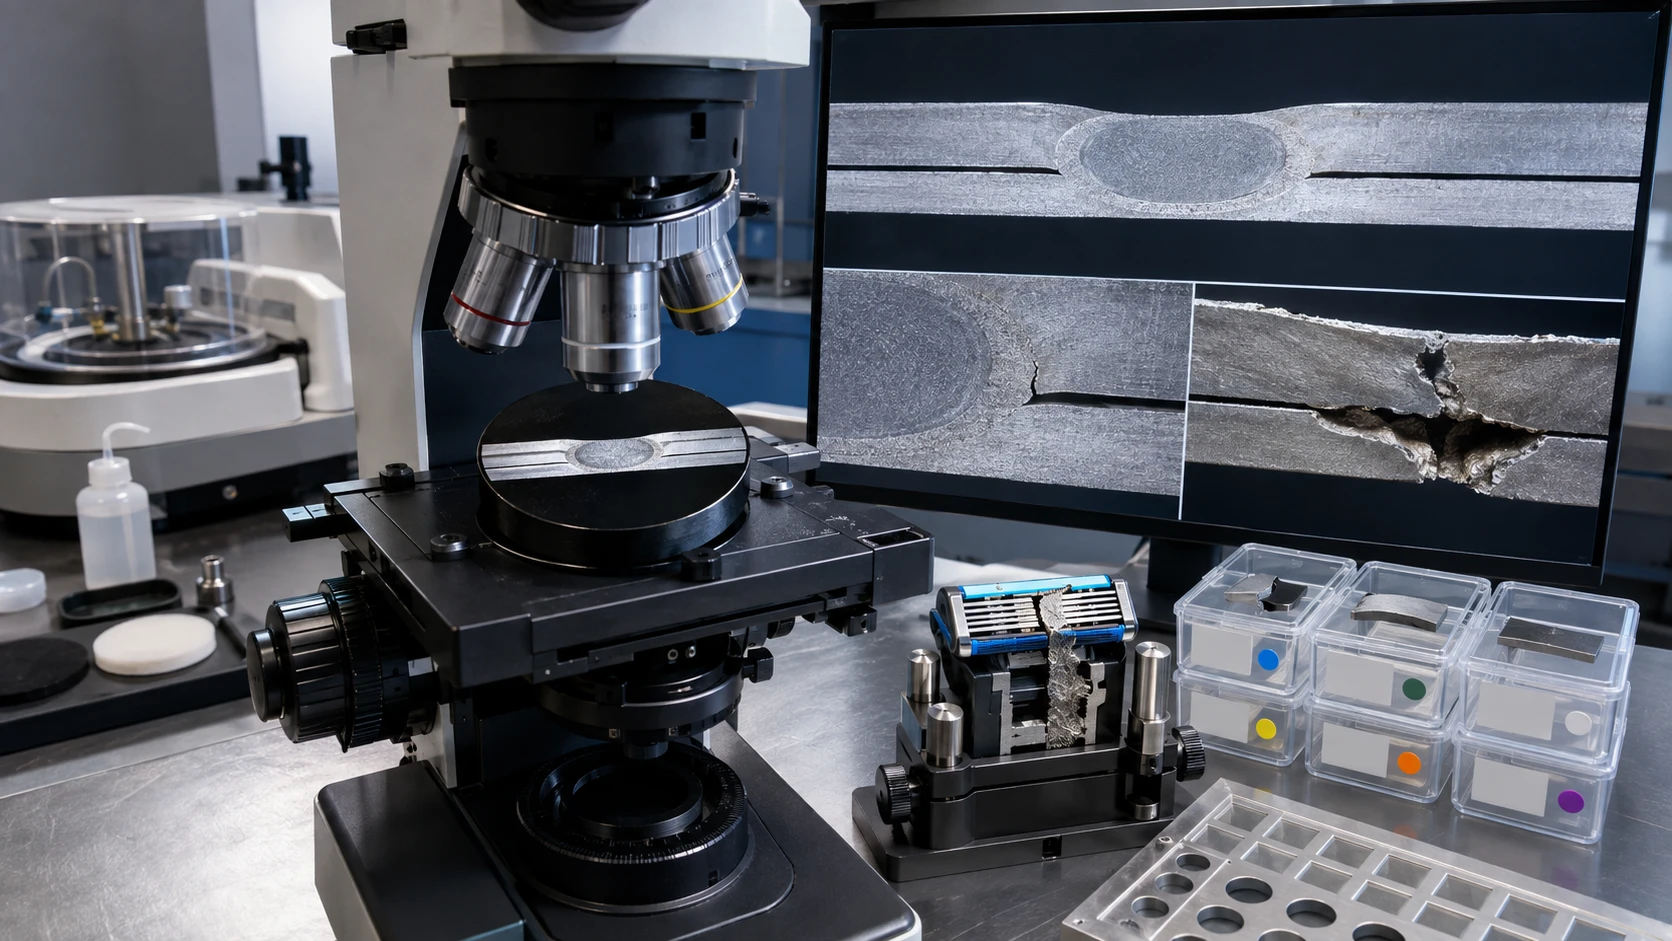
Prepare Cross-Sections Without Manufacturing False Defects
A force result states when the assembly separated. It does not prove why. Metallographic or macro-sectioning can reveal weld position, fusion geometry, interface condition, local thinning, cracks, voids, blade-support contact, and heat-affected distortion. For staking, sectioning can show formed-head coverage, post fill, undercut engagement, whitening, or an internal crack below an acceptable-looking surface.
- Mark joint orientation and preserve the station, cavity, lot, and sample ID.
- Cut away from the inspection plane using a low-heat method.
- Mount the part so thin metal and polymer layers remain supported.
- Grind and polish through a controlled sequence; document material removed.
- Use validated illumination or etching and capture a scale in each image.
- Compare the section with force data from the same process condition.
Smearing, overheating, edge rounding, and particle pull-out can imitate production defects. The work instruction must therefore define cut location, polishing sequence, magnification, measurement software, and image-acceptance rules. Section dimensions and defect limits remain drawing-specific; a section from one Razor platform cannot qualify another blade thickness or support geometry.
ISO 10447:2022, ISO 14272:2016, and ISO 14273:2016 provide useful concepts for spot-weld failure modes, cross-tension, and tensile-shear testing. Their published scopes begin at 0.5 mm sheet thickness, however. Razor constructions may be thinner and differently constrained. Adapt the principles, document deviations, correlate the internal method with sections and known defects, and never copy their specimen dimensions or forces as universal cartridge acceptance values.
Build a Destructive Sampling Plan Around Production Stations
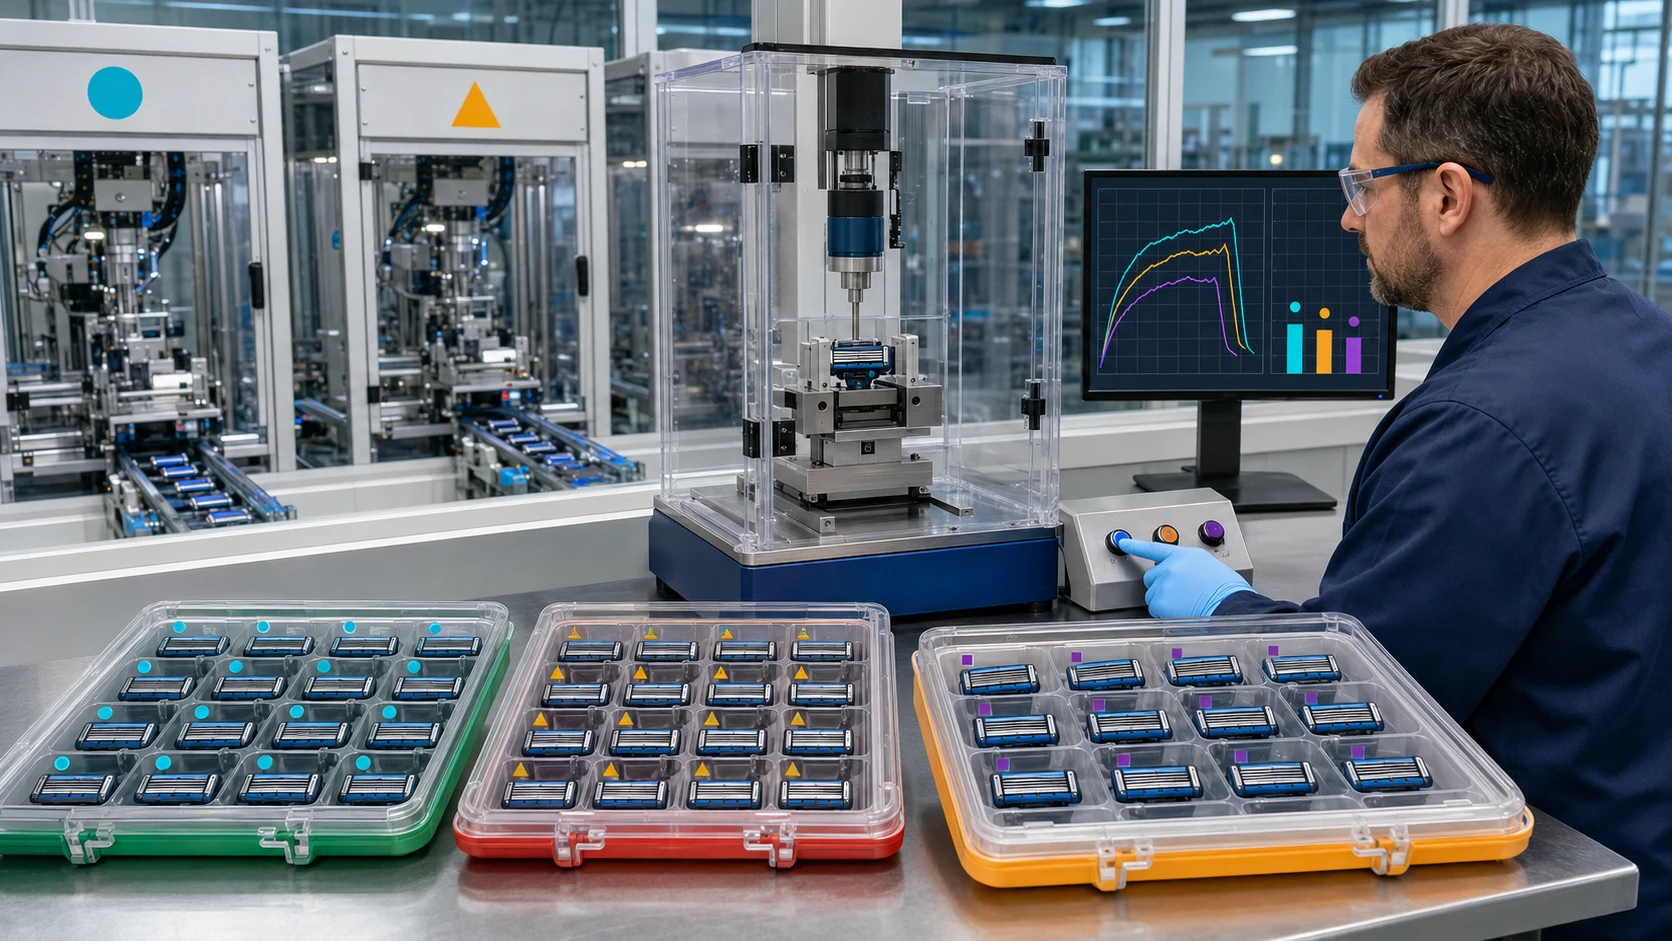
Sample Time, Station, Tool Position, and Material Lot
Random finished-goods sampling alone can miss a failing weld head or staking nest. Each sample must retain process identity. The control plan should connect the destructive result to the welding electrode pair, energy program, assembly station, mold cavity, shift, material lot, and maintenance state. Sampling should intensify after setup, electrode dressing, tool repair, alarm recovery, long stoppage, or engineering change.
The following matrix is an illustrative buyer-defined plan. It is not an industry standard or an acceptance rule.
| Control Point | Illustrative Destructive Quantity | Distribution | Required Decision |
|---|---|---|---|
| Setup approval | 3 consecutive cartridges per active station | Before saleable production | Release, adjust, or repeat setup |
| Pilot qualification | 30 assemblies across 3 lots | Beginning, middle, and end of each lot | Confirm method and preliminary capability |
| Routine production | 3 cartridges per station per shift | Separated across the run | Continue production or contain from last accepted check |
| Post-change verification | 10 per affected station or buyer-defined reset | After material, tooling, program, or repair change | Approve change or restore previous condition |
The final frequency must reflect failure severity, station count, process capability, lot size, detectability, and destination requirements. Destructive samples should be physically segregated and reconciled so tested units cannot return to saleable inventory.
Validate the Measurement System Before Comparing Suppliers or Lots
Prove Repeatability, Reproducibility, and Fixture Discrimination
A precise-looking force value is not automatically reliable. Thin blades flex, grips slip, and operators can load cartridges differently. Before setting a tight razor blade weld strength limit, run a measurement-system study using weak, nominal, and strong assemblies. Include multiple operators, fixture removals, and days. Because the test destroys the sample, use matched parts from controlled process groups or a suitable nested study rather than pretending the same assembly can be retested.
- Verify the force system over the actual working range, not only near full scale.
- Check zero, alignment, grip condition, travel, and software revision each test day.
- Use a master or verification artifact to detect fixture drift where practical.
- Record measurement uncertainty when results approach the drawing limit.
- Lock the raw curve and prohibit manual peak selection without an audit trail.
ISO/IEC 17025:2017 establishes competence, impartiality, and consistent-operation requirements for testing and calibration laboratories. It does not certify a particular Razor method. A Supplier should identify whether testing is performed under accredited scope, internally validated, or subcontracted, and the technical buyer should audit the evidence accordingly.
Classify Failure Modes Instead of Approving the Average
Link Every Curve, Photograph, and Section to a Failure Code
An average can conceal one dangerous low result. Report individual values, range, standard deviation, station, and failure mode. For a welded assembly, useful internal codes may distinguish interface separation, weld pull-out with surrounding material, blade-support tearing, base-metal fracture away from the weld, and grip-induced damage. For a blade staking test, distinguish post pull-out, formed-head fracture, support cracking, blade tearing, housing fracture, and fixture interference.
The curve adds evidence:
- a clean peak followed by rapid load loss can indicate a sudden joint fracture;
- progressive decline may show plastic deformation or sequential joint release;
- several peaks may mean multiple welds failed one after another; and
- an early irregular drop may reveal grip slip rather than a product failure.
Acceptance may require both a force threshold and an allowed failure mode. A high load followed by blade-edge damage may still be unacceptable. Conversely, a housing failure before the weld prevents the test from quantifying razor blade weld strength. Such a result should be classified as non-valid for weld measurement but evaluated separately for complete cartridge assembly integrity.
Turn Destructive Results into Process Control and Fast Containment
Define Reaction Rules Before the First Failure Occurs
A destructive plan has value only when a failed sample triggers a controlled response. The reaction plan should identify the last accepted check, quarantine boundary, re-test rule, product disposition authority, and escalation path. Do not allow an operator to average a failed value with additional samples unless the drawing and procedure explicitly permit that rule.
- Stop the affected station and preserve its machine settings.
- Quarantine output since the last conforming station-specific sample.
- Retain the failed assembly, fracture pieces, raw curve, and fixture image.
- Check weld energy, current, force, electrode wear, staking displacement, and tool alignment.
- Section suspect and known-good joints from the same time window.
- Verify corrective action with an approved restart sample plan.
- Document disposition and communicate affected shipment status to the buyer.
This sequence reduces mixed-lot risk, unauthorized release, and repeated failure. For Customizable OEM or ODM programs, Haward and the brand should agree on escalation timing, deviation authority, retention samples, and data-sharing format before mass production.
A stable SKU can hide changes in blade thickness, support alloy, coating, weld-electrode profile, energy program, staking resin, mold cavity, assembly speed, or nest wear. Require written engineering change control. At design review, tool acceptance, pilot audit, mass-production audit, and change audit, review drawing limits, fixture qualification, traceability, reaction records, and requalification scope. An ISO 9001 certificate supports process discipline but does not prove a specific cartridge passed its drawing. The Manufacturer must still provide raw results, calibration evidence, traceable samples, nonconformance records, and approved changes.
Make Assembly Strength a Drawing-Controlled Purchase Requirement
Do not accept one generic pull-force certificate for every cartridge. Send Haward your joint drawing, retention risks, intended failure mode, station layout, and reporting needs. We can develop a Customizable OEM or ODM destructive-test plan with traceable fixtures, sectioning, sampling, and drawing-specific acceptance rules.